
从CT图像中分割肺部,展示了多种分割方法,最终获取mask。通过多方查找相关的教程,将我们组的课程任务完成情况总结记录如下:
任务说明
肺癌手术治疗的关键是尽可能少的切除感染部位并保留大部分健康的肺组织。传统的计算机手术辅助系统在PC屏幕上显示病人的CT图像。但这种辅助系统不是真正的三维系统,不能很好地向外科医生展示患者肺血管和气管的位置。
为了更好的显示患者的肺部三维结构,我们通过对患者的肺部CT数据进行分析和处理,实现对肺部的分割提取并对提取的肺部数据进行模型创建,尽可能准确的还原肺部的结构。
技术方案
原始数据为某人的肺部CT图,我们需要对CT图数据进行处理,然后根据处理过的数据分割获取肺部组织的结构进行模型重建。
肺部实质分割
处理CT数据的时候,我们需要获取肺部的mask来实现肺部结构的提取。我们主要采用了阈值分割、图像形态学、图像连通域等方法来进行肺部的分割。
肺部模型重建
通过对每一张CT切片进行肺部实质分割,我们得到每一张CT切片中的肺部结构图(以数组的方式存储),多张切片组合成一个三维数组。然后,我们可以通过marching_cubes方法计算三维数据中的曲面并使用matpoltlib和matlab分别显示肺部的的三维模型。
环境介绍
编程语言:Python
主要使用的第三方库:skimage、matplotlib、mayavi
(1)Python
Python 是一种面向对象、解释型、弱类型的脚本语言,它也是一种功能强大而完善的通用型语言。
相比其他编程语言,Python代码非常简单,上手非常容易。比如我们要完成某个功能,如果用Java需要100行代码,但用Python可能只需要20行代码,这是Python具有巨大吸引力的一大特点。
同时,Python具有完备的语言生态,有很多可用的第三方库,且第三方库的安装和使用非常方便,极大的简化了Python程序的编写。
(2)skimage
skimage的全称是scikit-image SciKit (toolkit for SciPy) ,它对scipy.ndimage进行了扩展,提供了更多的图片处理功能。它是由python语言编写的,由scipy 社区开发和维护。skimage库由许多子模块组成,各个子模块提供不同的功能。主要子模块有:
■ filters——图像增强、边缘检测、排序滤波器、自动阈值等
■ draw——操作于numpy数组上的基本图形绘制,如线条、矩形、圆等
■ transform——几何变换或其它变换,如旋转、拉伸和拉式变换等
■ morphology——形态学操作,如开闭运算、骨架提取等
■ exposure——图片强度调整,如亮度调整、直方图均衡等
■ feature——特征检测与提取等
■ measure——图像属性的测量,如相似性或等高线等
(3)matplotlib
matplotlib是Python中最常用的可视化工具之一,可以非常方便地创建海量类型的2D图表和一些基本的3D图表,可根据数据集自行定义x、y轴,绘制图形(线形图,柱状图,直方图,密度图,散布图等),能够满足大部分的需要。matplotlib中最基础的模块是pyplot。
(4)mayavi
Mayavi2完全用Python编写,因此它不但是一个方便实用的可视化软件,而且可以方便地用Python编写扩展,嵌入到用户编写的Python程序中,或者直接使用其面向脚本的API:mlab快速绘制三维图。
技术实现
肺部实质分割
CT图中包含扫描区域的所有物体,包括床板、衣物、人体组织等等,首先需要做的便是将肺部实质提取出来,去除所有其他我们不关注的数据信息。以一张CT切片为例,整个流程如下所示:
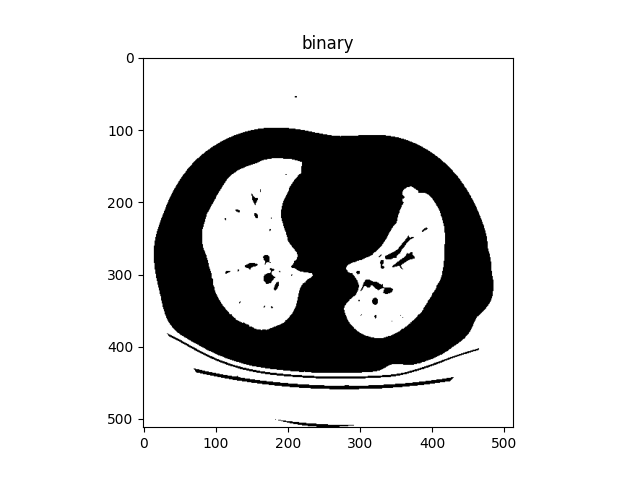
(1)二值化
由于CT值的范围是-1000~+1000,所以可以根据不同组织或者结构的CT值对CT图进行二值化操作。对与肺部CT而言,一般以空气的CT值(-300)为界,将大于-300的位置置为1,小于-300的位置置为0。这样就可以将数据分为外部空气、内部空气、躯干组织。如下图所示:
(2)处理边界
边界处理是为了将轮廓外的1值清除,达到删除其他杂物的目的,获得的图像结果如下所示:
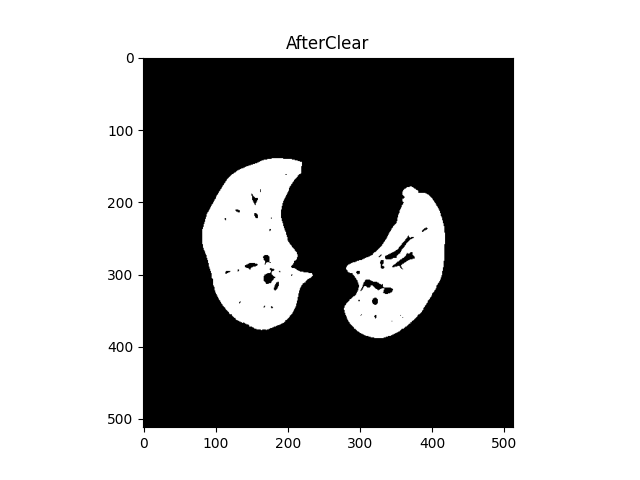
(3)标记连通区域
在二值图像中,如果两个像素点相邻且值相同(同为0或同为1),那么就认为这两个像素点在一个相互连通的区域内。而同一个连通区域的所有像素点,都用同一个数值来进行标记,这个过程就叫连通区域标记。我们使用label方法对边界处理过后的图像结果做连通区域划分。
(4)保留最大的两个连通区域
对于一张CT图而言,去除了其他杂物和组织之后,剩余的部分中肺部组织占据了最大的面积。因此,对于标记了连通区域后的图像,我们仅保留最大的两个连通区域,即左肺和右肺。遍历所有的连通区域,将除了最大两个连通区域以外的所有其他位置全部置为0,获得的结果如下所示:

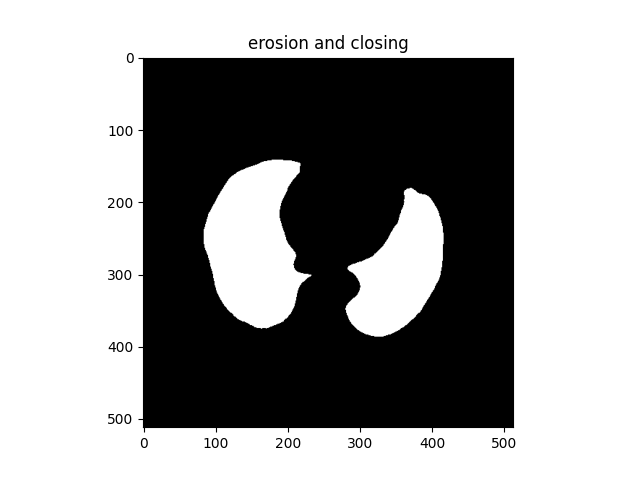
(5)腐蚀和闭包操作
通过腐蚀和闭包操作,处理肺部组织中的细节,结果如下所示:
(6)填充形成mask
将腐蚀和闭包操作之后的结果做填充完整作为最终的mask结果,最终得到的肺部mask结果如下所示:

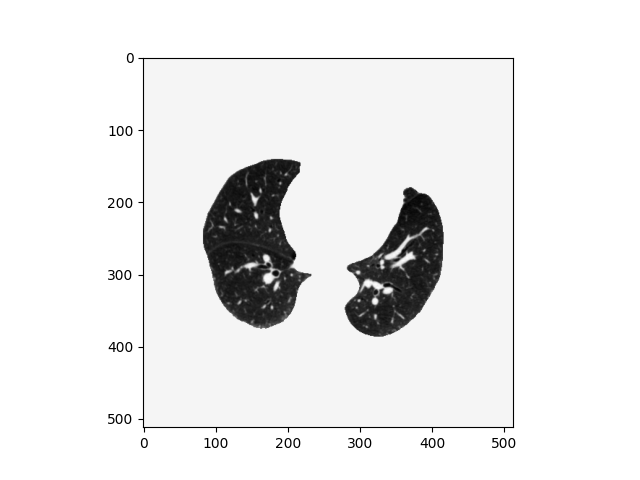
(7)肺部分割结果
对每一张切片而言,对切片处理获得对应的肺部mask结果,然后将原始切片的非mask区域置为0,仅保留肺部组织即可。最终的到的分割结果如下所示:
这里只以单张CT图的处理过程为例讲解肺部分割提取的结果,我们对于每一张的CT图都做相同的操作获取到每一个切片的肺部组织数据,用于最终的建模。这里给出单张CT图的肺部分割代码:
# 绘制图片结果
def printImage(image,imgName):
    plt.title(imgName)
    plt.imshow(image,cmap="gray")
    plt.show()

# 该函数用于从给定的2D切片中分割肺
def get_segmented_lungs(im, spacing, threshold=-300):
    # 步骤1: 二值化
    binary = im < threshold # 显示二值化 # printImage(binary,"binary") # 步骤2: 清除边界上的斑点 cleared = clear_border(binary) # printImage(cleared,"AfterClear") # 步骤3: 标记联通区域 label_image = label(cleared) # 保留两个最大的联通区域,即左右肺部区域,其他区域全部置为0 areas = [r.area for r in regionprops(label_image)] areas.sort() if len(areas) > 2:
        for region in regionprops(label_image):
            if region.area < areas[-2]: for coordinates in region.coords: label_image[coordinates[0], coordinates[1]] = 0 binary = label_image > 0
    # printImage(binary,"keep lungs")

    # 腐蚀操作
    selem = disk(2)
    binary = binary_erosion(binary, selem)
    # 闭包操作
    selem = disk(10)
    binary = binary_closing(binary, selem)
    # printImage(binary,"erosion and closing")

    # 填充操作
    edges = roberts(binary)
    binary = ndi.binary_fill_holes(edges)
    # printImage(binary,"mask")
    # 返回最终的结果
    return binary

#读取图片,一张CT切片的路径
path = "F:/data/631165.dcm"
data = sitk.ReadImage(path)
spacing = data.GetSpacing()
scan = sitk.GetArrayFromImage(data)
# 获取当前CT切片的mask
mask = np.array([get_segmented_lungs(scan.copy().squeeze(0), spacing)])
# 将mask以外的值置为0,仅保留肺部结构
scan[~mask] = 0
# 显示分割结果
plt.imshow(scan[0],cmap="gray")
plt.show()
肺部模型重建
肺部模型的重建工作基于对每一张CT切片的处理结果之上,将所有的切片数据做肺部组织的分割和提取,然后构成三维坐标数据,最后根据提取的三维坐标进行模型重绘。
首先,我们使用skimage库中measure子模块中的marching_cubes方法根据提取的三维坐标计算曲面;然后,我们采用了matplotlib的3D绘图和mayavi中的mlab分别进行三维图形的绘制;最后,我们使用3D Slicer软件对肺部进行精细化建模,将三者进行对比。
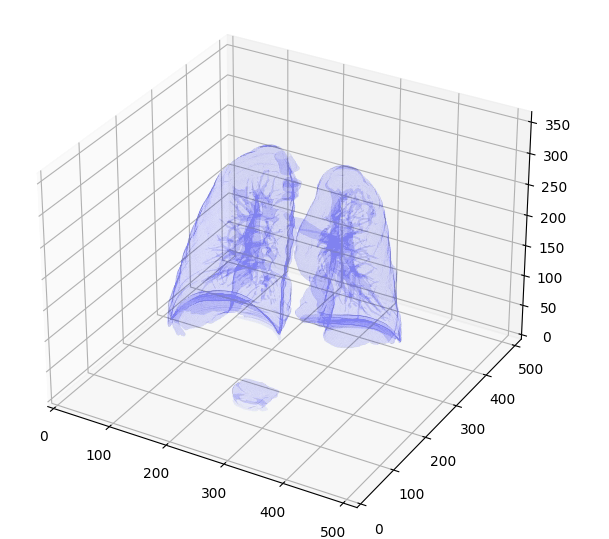
(1)使用matplotlib绘制三维模型
设置好3D绘图的属性后,对分割结果进行绘制,绘制函数编写如下:
# 使用matplotlib绘图
def plot_3d_with_plt(image, threshold=-150):
    p = image.transpose(2,1,0)
    print(image.shape)
    verts,faces,_,_ = measure.marching_cubes(p, threshold)
    # plt绘制
    fig = plt.figure(figsize=(10, 10))
    ax = fig.add_subplot(111, projection='3d')
    # Fancy indexing: `verts[faces]` to generate a collection of triangles
    mesh = Poly3DCollection(verts[faces], alpha=0.1)
    face_color = [0.5, 0.5, 1]
    mesh.set_facecolor(face_color)
    ax.add_collection3d(mesh)

    ax.set_xlim(0, p.shape[0])
    ax.set_ylim(0, p.shape[1])
    ax.set_zlim(0, p.shape[2])

    plt.show()
绘制结果如下所示:
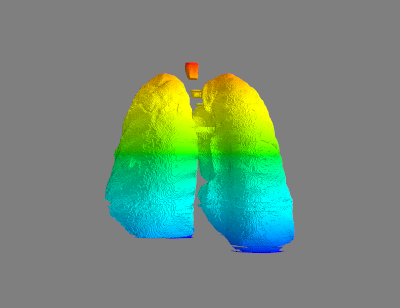
(2)使用mlab绘制三维面模型
使用mlab进行绘制的函数比较简单,但是绘制结果图的显示效果优于matplotlib绘制的结果,代码如下所示:
# 使用mlab绘图
def plot_3d_with_mlab(image, threshold=-150):
    p = image.transpose(2,1,0)
    print(image.shape)
    verts,faces,_,_ = measure.marching_cubes(p, threshold)
    verts = verts.T
    mlab.triangular_mesh([verts[0]], [verts[1]], [verts[2]], faces)
    mlab.show()
绘制结果如下所示:
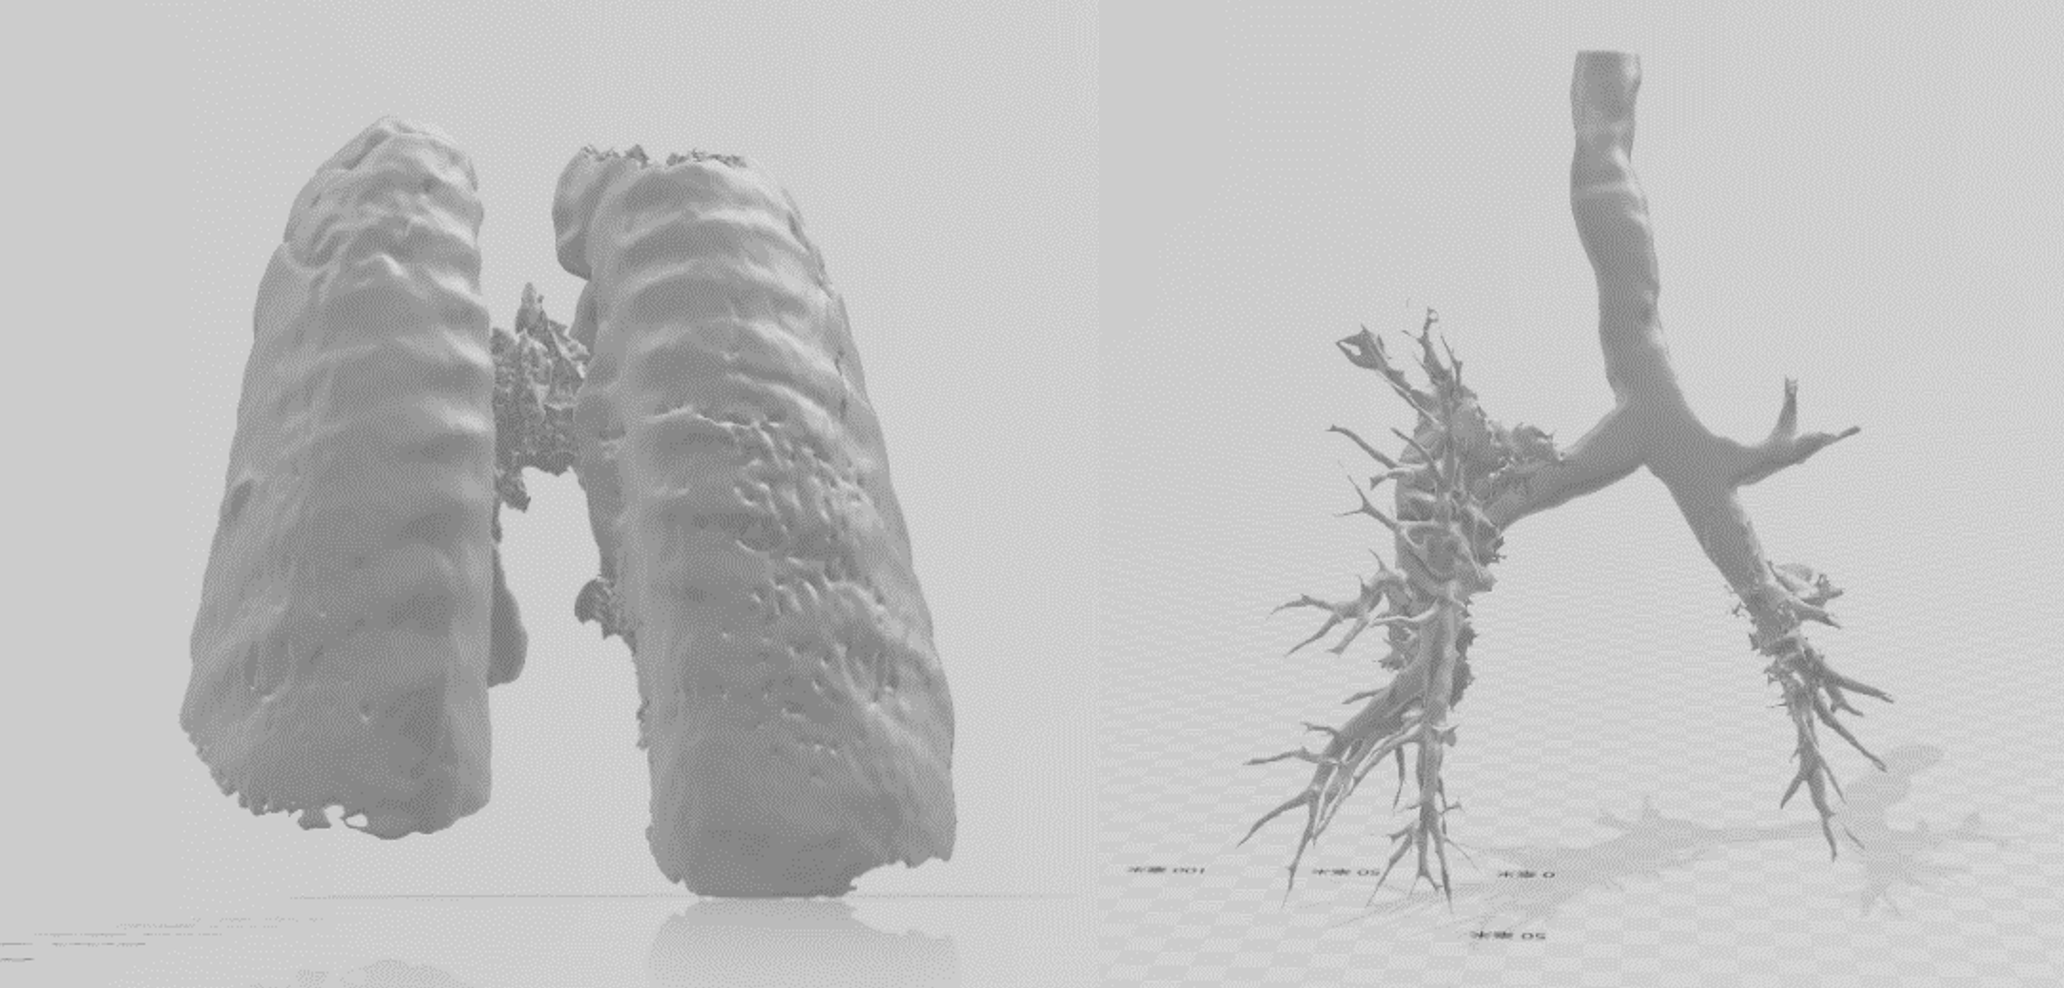
(3)与3D Slicer的建模结果对比
我们使用了3D Slicer进行了更加精细化的建模,该软件的建模需要手动标注用于区分不同的组织。尤其是对于气道这样的组织,可以通过对多张CT图和不同视图的标记帮助软件更好的对肺部进行建模。我们使用该软件对给定的CT数据进行建模的结果如下所示:
完整的代码如下所示:
from optparse import Values
from skimage.segmentation import clear_border
from skimage.measure import label,regionprops, perimeter
from skimage.morphology import ball, disk, dilation, binary_erosion, remove_small_objects, erosion, closing, reconstruction, binary_closing
from skimage.filters import roberts, sobel
from scipy import ndimage as ndi
import scipy.ndimage
import numpy as np
from skimage import measure, feature
from mpl_toolkits.mplot3d import Axes3D
from mpl_toolkits.mplot3d.art3d import Poly3DCollection
from skimage import measure
import os
import SimpleITK as sitk
import matplotlib.pyplot as plt
from mayavi import mlab

# 该函数用于从给定的2D切片中分割肺
def get_segmented_lungs(im, spacing, threshold=-300):
    # 步骤1: 二值化
    binary = im < threshold # 步骤2: 清除边界上的斑点 cleared = clear_border(binary) # 步骤3: 标记联通区域 label_image = label(cleared) # 保留两个最大的联通区域,即左右肺部区域,其他区域全部置为0 areas = [r.area for r in regionprops(label_image)] areas.sort() if len(areas) > 2:
        for region in regionprops(label_image):
            if region.area < areas[-2]: for coordinates in region.coords: label_image[coordinates[0], coordinates[1]] = 0 binary = label_image > 0
    # 腐蚀操作,分割肺部的细节
    selem = disk(2)
    binary = binary_erosion(binary, selem)
    # 闭包操作
    selem = disk(10)
    binary = binary_closing(binary, selem)

    edges = roberts(binary)
    binary = ndi.binary_fill_holes(edges)
    # 返回最终的结果
    return binary

# 提取主要部分,选取不符合肺部实质特征的部分进行过滤
def extract_main(mask, spacing, vol_limit=[0.68, 8.2]):
    voxel_vol = spacing[0]*spacing[1]*spacing[2]
    label = measure.label(mask, connectivity=1)
    properties = measure.regionprops(label)
    for prop in properties:
            if prop.area * voxel_vol < vol_limit[0] * 1e6 or prop.area * voxel_vol > vol_limit[1] * 1e6:
                mask[label == prop.label] = 0
    return mask

# 显示ct切片的分割结果
def plot_ct_scan(scan, num_column=4, jump=1):
    num_slices = len(scan)
    num_row = (num_slices//jump + num_column - 1) // num_column
    f, plots = plt.subplots(num_row, num_column, figsize=(num_column*5, num_row*5))
    for i in range(0, num_row*num_column):
        plot = plots[i % num_column] if num_row == 1 else plots[i // num_column, i % num_column]
        plot.axis('off')
        if i < num_slices//jump:
            plot.imshow(scan[i*jump], cmap=plt.cm.bone)

# 使用matplotlib绘图
def plot_3d_with_plt(image, threshold=-150):
    p = image.transpose(2,1,0)
    print(image.shape)
    verts,faces,_,_ = measure.marching_cubes(p, threshold)
    # plt绘制
    fig = plt.figure(figsize=(10, 10))
    ax = fig.add_subplot(111, projection='3d')
    # Fancy indexing: `verts[faces]` to generate a collection of triangles
    mesh = Poly3DCollection(verts[faces], alpha=0.1)
    face_color = [0.5, 0.5, 1]
    mesh.set_facecolor(face_color)
    ax.add_collection3d(mesh)

    ax.set_xlim(0, p.shape[0])
    ax.set_ylim(0, p.shape[1])
    ax.set_zlim(0, p.shape[2])

    plt.show()

# 使用mlab绘图
def plot_3d_with_mlab(image, threshold=-150):
    p = image.transpose(2,1,0)
    print(image.shape)
    verts,faces,_,_ = measure.marching_cubes(p, threshold)
    verts = verts.T
    mlab.triangular_mesh([verts[0]], [verts[1]], [verts[2]], faces)
    mlab.show()
# 存放数据的文件夹
root = 'F:/data'
paths = os.listdir(root)
tem = np.empty(shape=(0,512,512))
for path in paths:
    # 读取CT图,对每一张进行分割提取
    data =sitk.ReadImage(os.path.join(root,path))
    spacing = data.GetSpacing()
    scan = sitk.GetArrayFromImage(data)
    mask = np.array([get_segmented_lungs(scan.copy().squeeze(0), spacing)])
    scan[~mask] = 0
    tem = np.append(tem, scan, axis=0)

print(tem.shape)
scan = tem[::-1]                #读取文件的顺序和实际模型颠倒,所以这里做一个逆序
plot_3d_with_plt(scan)          #绘制建模结果
plot_3d_with_mlab(scan)         #绘制建模结果
结果分析
通过对结果的分析和比较,我们发现自己使用的分割和重建方法难以对肺部组织和气道进行明显的区分。虽然,我们可以通过调节相应的参数获取不带有气道的完整肺部结构,但是比较难以将气道和肺部组织进行分离,尤其是在肺部和气道的交界处。如何使用CT图中的数据特征更加准确的区分肺部组织和气道组织是一个可以进一步深入研究的课题。